How much heat do I deliver where?
Several heat meters deliver series, but no overall picture.
Schwerpunkt: Lokale KI und Pseudomizer. Zusammen. Mehr
Branchenpartner gesucht. Partner werden
Ihre Branche: Rechtsanwalt oder NotarSteuerberaterArzt, Zahnarzt oder PraxisBiogas und EnergieIndustrie und MaschinenbauSchule und BildungLandwirtschaftHandwerkBüro, Verwaltung, Kommune
Concern 5 · heat
The heat network at a glance: sites, meters, flow and return, output, flow rate and storage. One click on a card opens the chart.
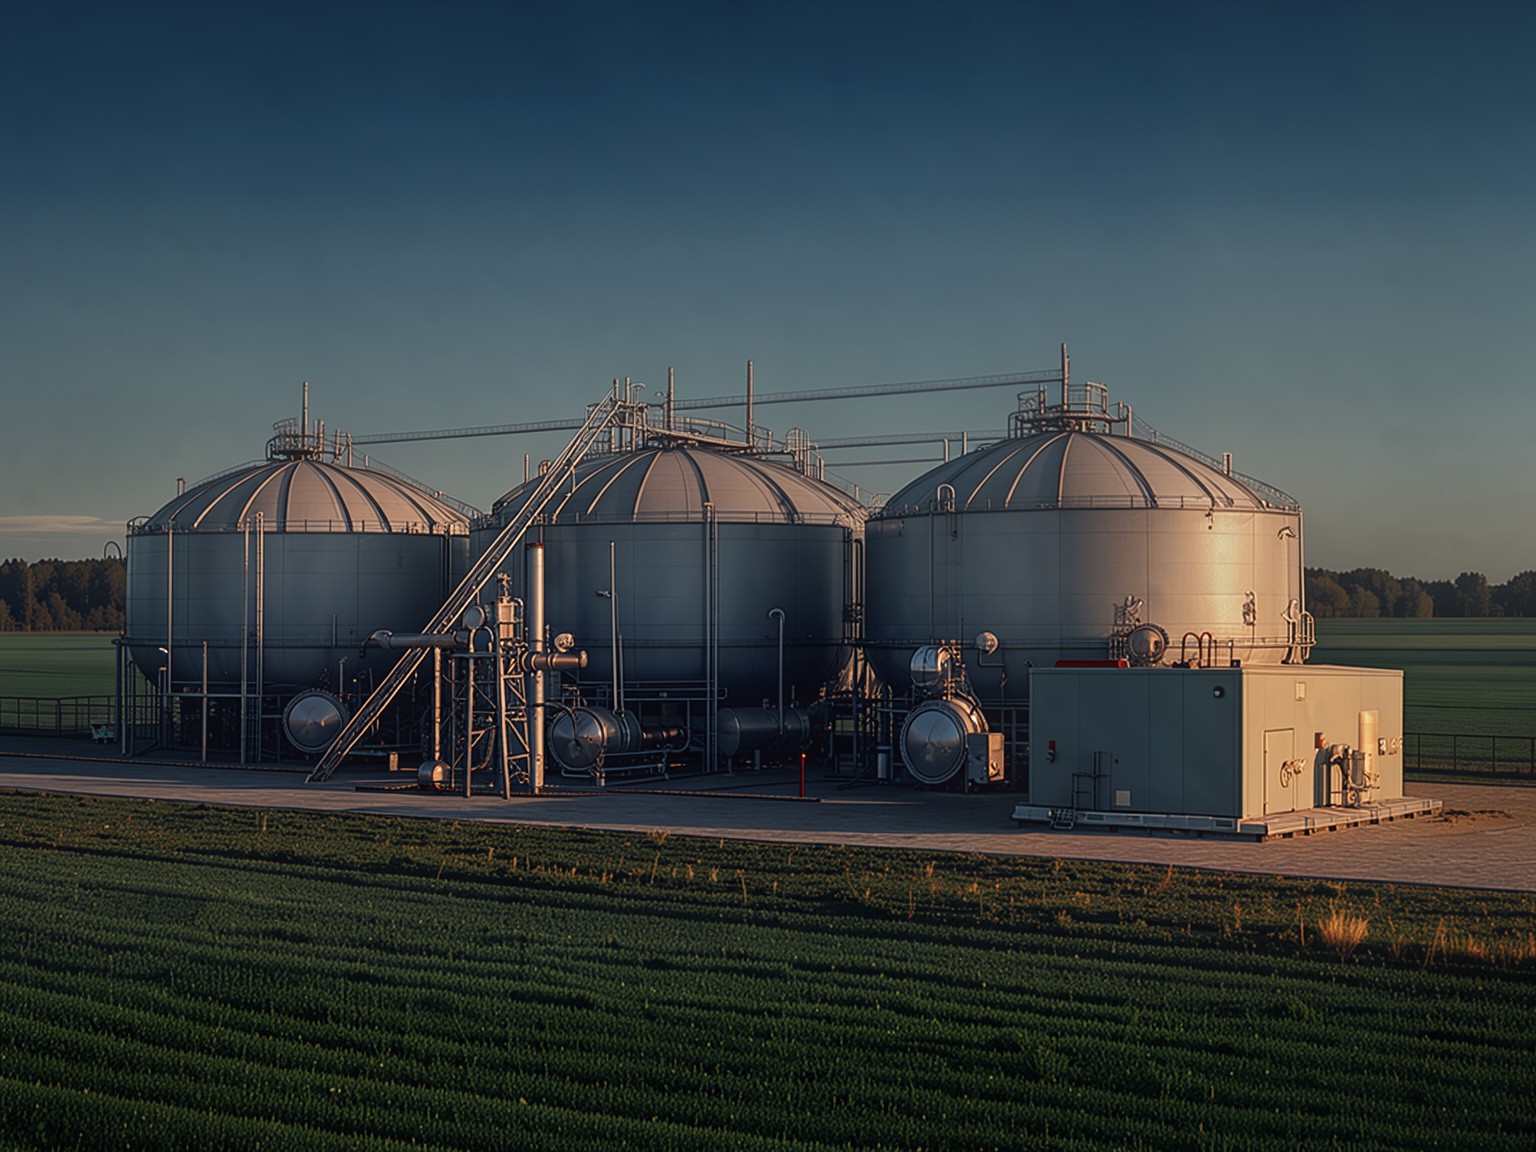
Sound familiar?
Several heat meters deliver series, but no overall picture.
Flow and return temperature show whether the network works cleanly.
The fill level decides how flexibly the engine can run.
How the learning system answers
The cards in the network diagram show the current state. A click opens flow, return, output and flow rate over 24 hours, 7 or 30 days.
How was the heat delivery at the sites last week?
Site 1 was above site 2 for most of the week. At the weekend output dropped at both. The series are linked.
Source: heat meters, plant raw values, updated continuously
Example with invented data
Every number comes from a fixed calculation, not from the language model. Every answer names its source.
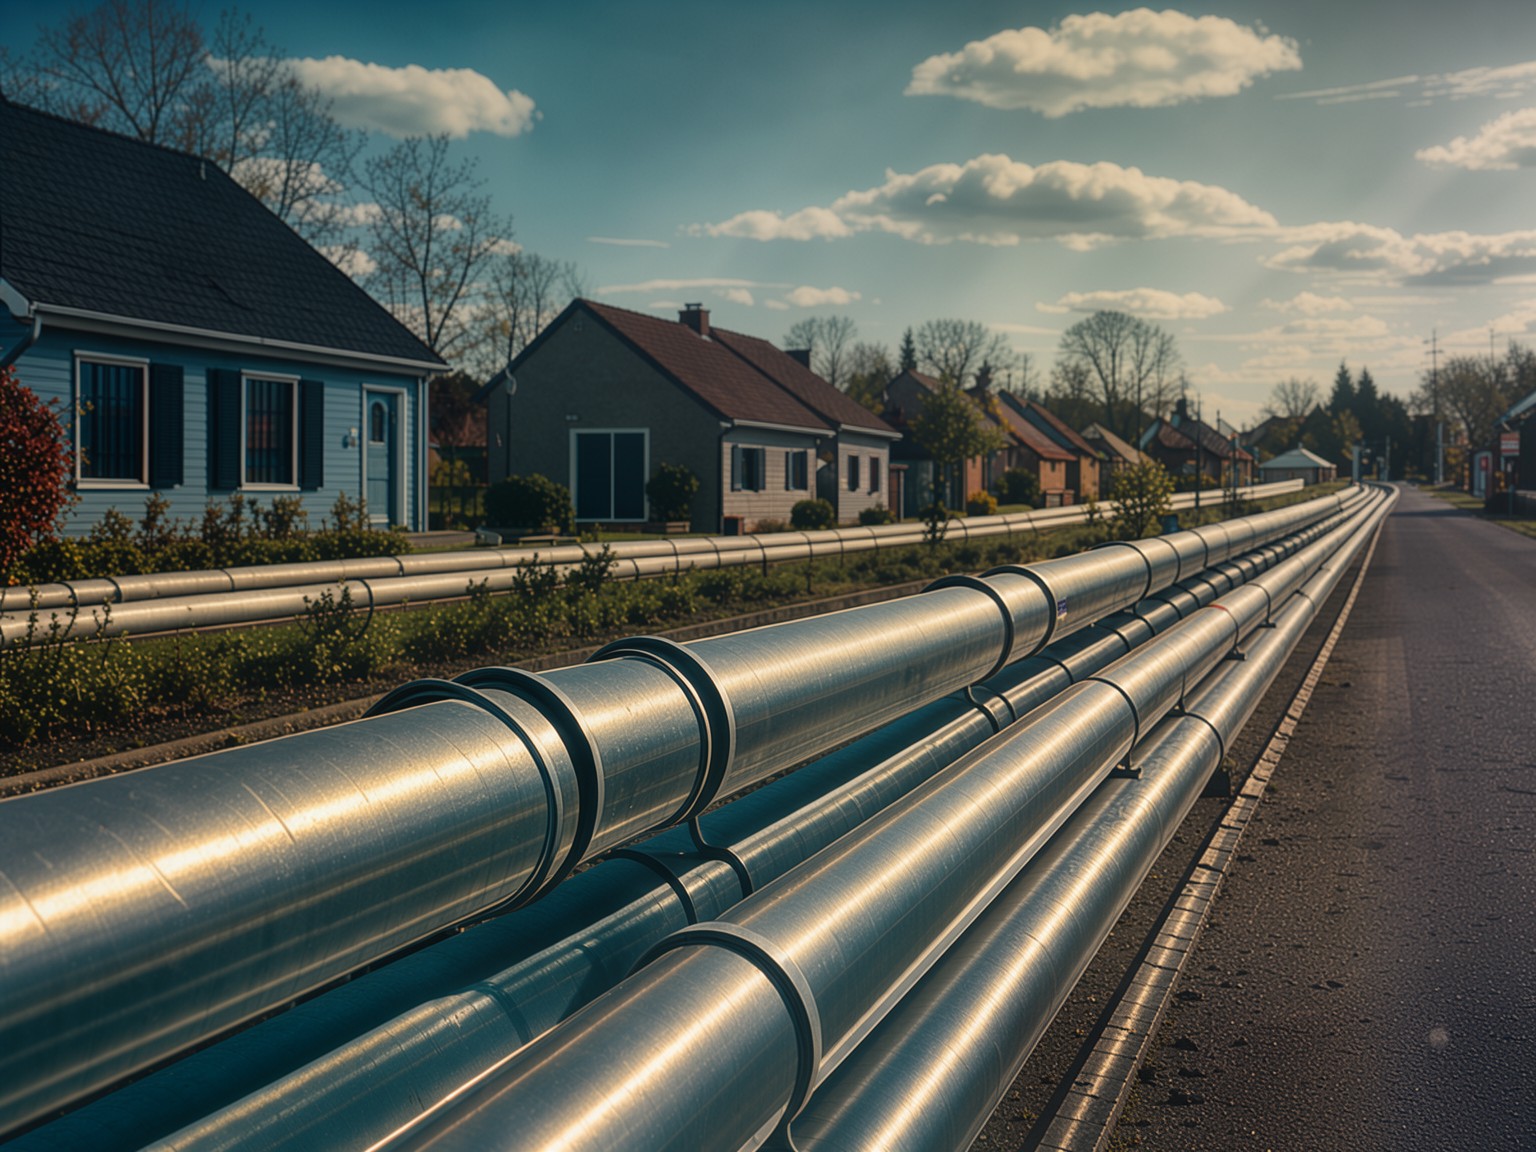
Several sites, several meters, one picture.
What it looks like
The two temperatures on top, the output below. One shared zoom applies to both.
Example with invented values
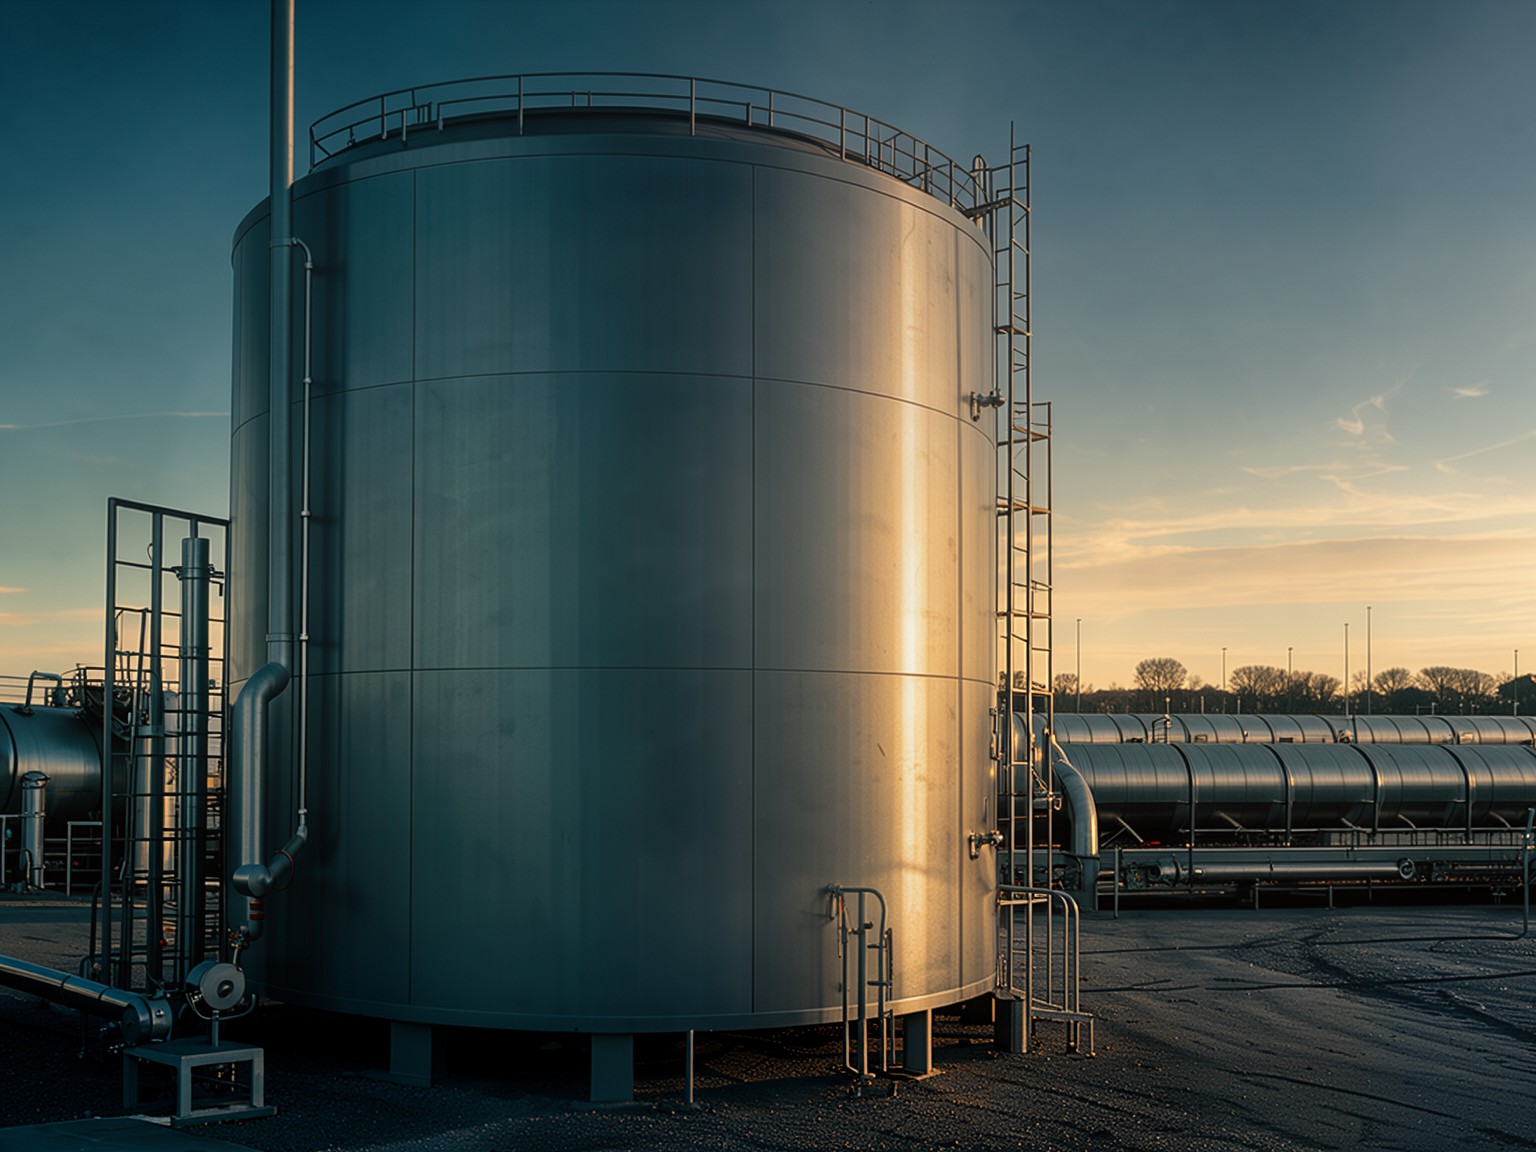
The fill level decides how flexibly the engine can run.
How it works
The raw values of the meters are fetched at short intervals.
Every site has its own meters and storage. They are not mixed.
A click on a card opens the chart for the chosen period.
Learning system and Pseudomizer
A system of your own with its own storage. It reads your documents and measurement data, answers in plain sentences and names the source. At night it asks itself new questions and reports gaps.
More on the local AIIf you also want to use a large cloud AI, the Pseudomizer creates a shadow copy and checks it with subject-specific check chains. The original stays with you. Leak rate at the exit: 0.00 %. Guards detect, the judge stage blocks when in doubt, healing cleans up.
To the PseudomizerMore concerns
The plant's own consumption split across consumers, even when not everything is measured.
To the pageFeeding recommendation next to the electricity prices: substrates, amounts and times.
To the pageElectricity price outlook as a heat map, to plan operation against the price.
To the pageOriginal versus mirror: use cloud AI without originals leaving the house.
To the pageOne conversation, one real task from your daily work. We use it to show what AI and automation can do for you.